Beam Usage Example
How to create a beam:
In [1]: import fconcrete as fc

In [2]: n1 = fc.Node.SimpleSupport(x=0)

In [3]: n2 = fc.Node.SimpleSupport(x=250)

In [4]: n3 = fc.Node.SimpleSupport(x=500)

In [5]: f1 = fc.Load.UniformDistributedLoad(-0.1, x_begin=0, x_end=250)

In [6]: f2 = fc.Load.UniformDistributedLoad(-0.3, x_begin=250, x_end=500)

In [7]: section = fc.Rectangle(12, 25)

In [8]: material = fc.Material(E=10**6, poisson=1, alpha=1)

In [9]: beam_element_1 = fc.BeamElement([n1, n2], section, material)

In [10]: beam_element_2 = fc.BeamElement([n2, n3], section, material)

In [11]: beam = fc.Beam(loads=[f1, f2], beam_elements=[beam_element_1, beam_element_2])
You can use all properties and methods of the Beam Class such as plot shear diagram, momentum, etc.
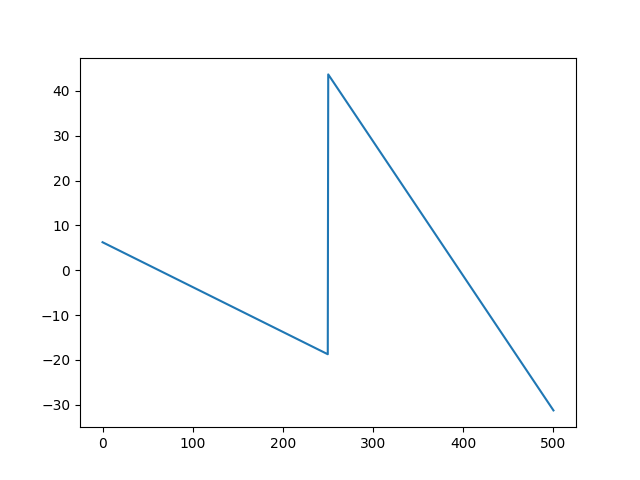
Plot Shear Diagram:
In [12]: beam.plotShearDiagram()
Out[12]:
(<matplotlib.axes._subplots.AxesSubplot at 0x7f5b51f2b908>,
 <ezdxf.layouts.layout.Modelspace at 0x7f5b4f8bfdd8>)
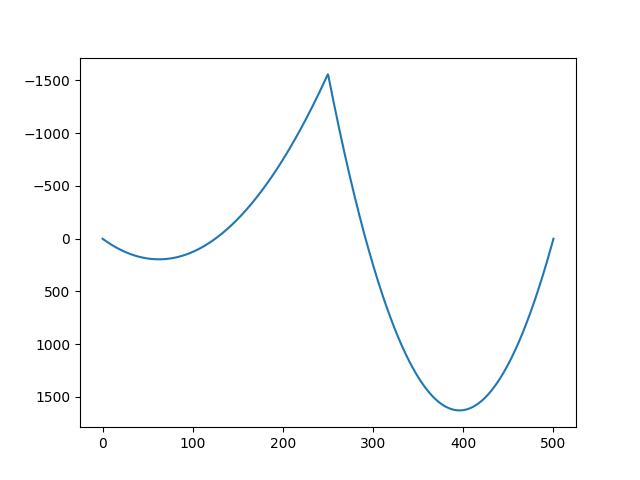
Plot Momentum Diagram:
In [13]: beam.plotMomentumDiagram()
Out[13]:
(<matplotlib.axes._subplots.AxesSubplot at 0x7f5b4f22f198>,
 <ezdxf.layouts.layout.Modelspace at 0x7f5b4f22ffd0>)
Plot Displacement Diagram:
In [14]: beam.plotDisplacementDiagram()
Out[14]:
(<matplotlib.axes._subplots.AxesSubplot at 0x7f5b4f1ab860>,
 <ezdxf.layouts.layout.Modelspace at 0x7f5b51d95470>)
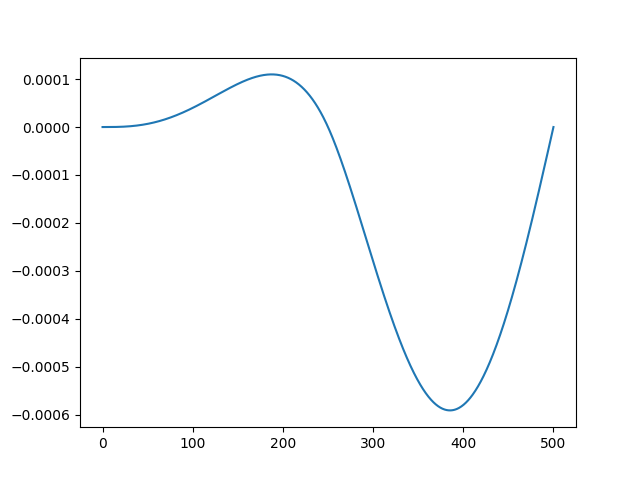
If you only want to get the values, but not to plot. You can use the “get” instead of “plot”.
In [15]: x, displacement = beam.getDisplacementDiagram()

In [16]: print(x[0:10])
[1.00000000e-05 5.00510480e-01 1.00101096e+00 1.50151144e+00
 2.00201192e+00 2.50251240e+00 3.00301288e+00 3.50351336e+00
 4.00401384e+00 4.50451432e+00]

In [17]: print(displacement[0:10])
[1.01361134e-25 8.34214859e-12 6.66013167e-11 2.24325385e-10
 5.30660630e-10 1.03435172e-09 1.78374174e-09 2.82677213e-09
 4.21098277e-09 5.98351191e-09]
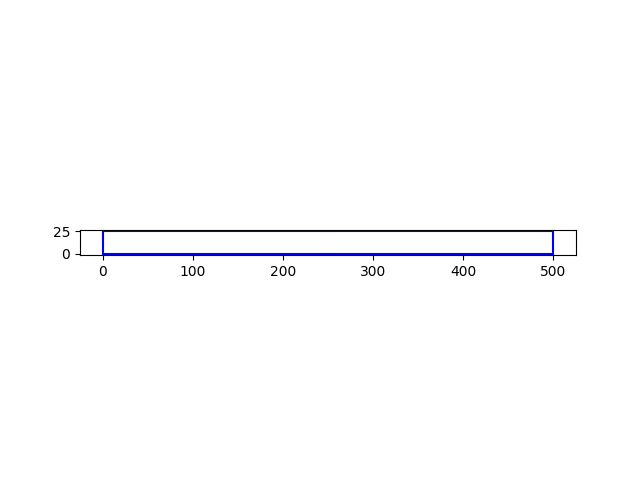
Plot of the beam:
In [18]: beam.plot()
Out[18]:
(<matplotlib.axes._subplots.AxesSubplot at 0x7f5b51ab2c88>,
 <ezdxf.layouts.layout.Modelspace at 0x7f5b51c583c8>)